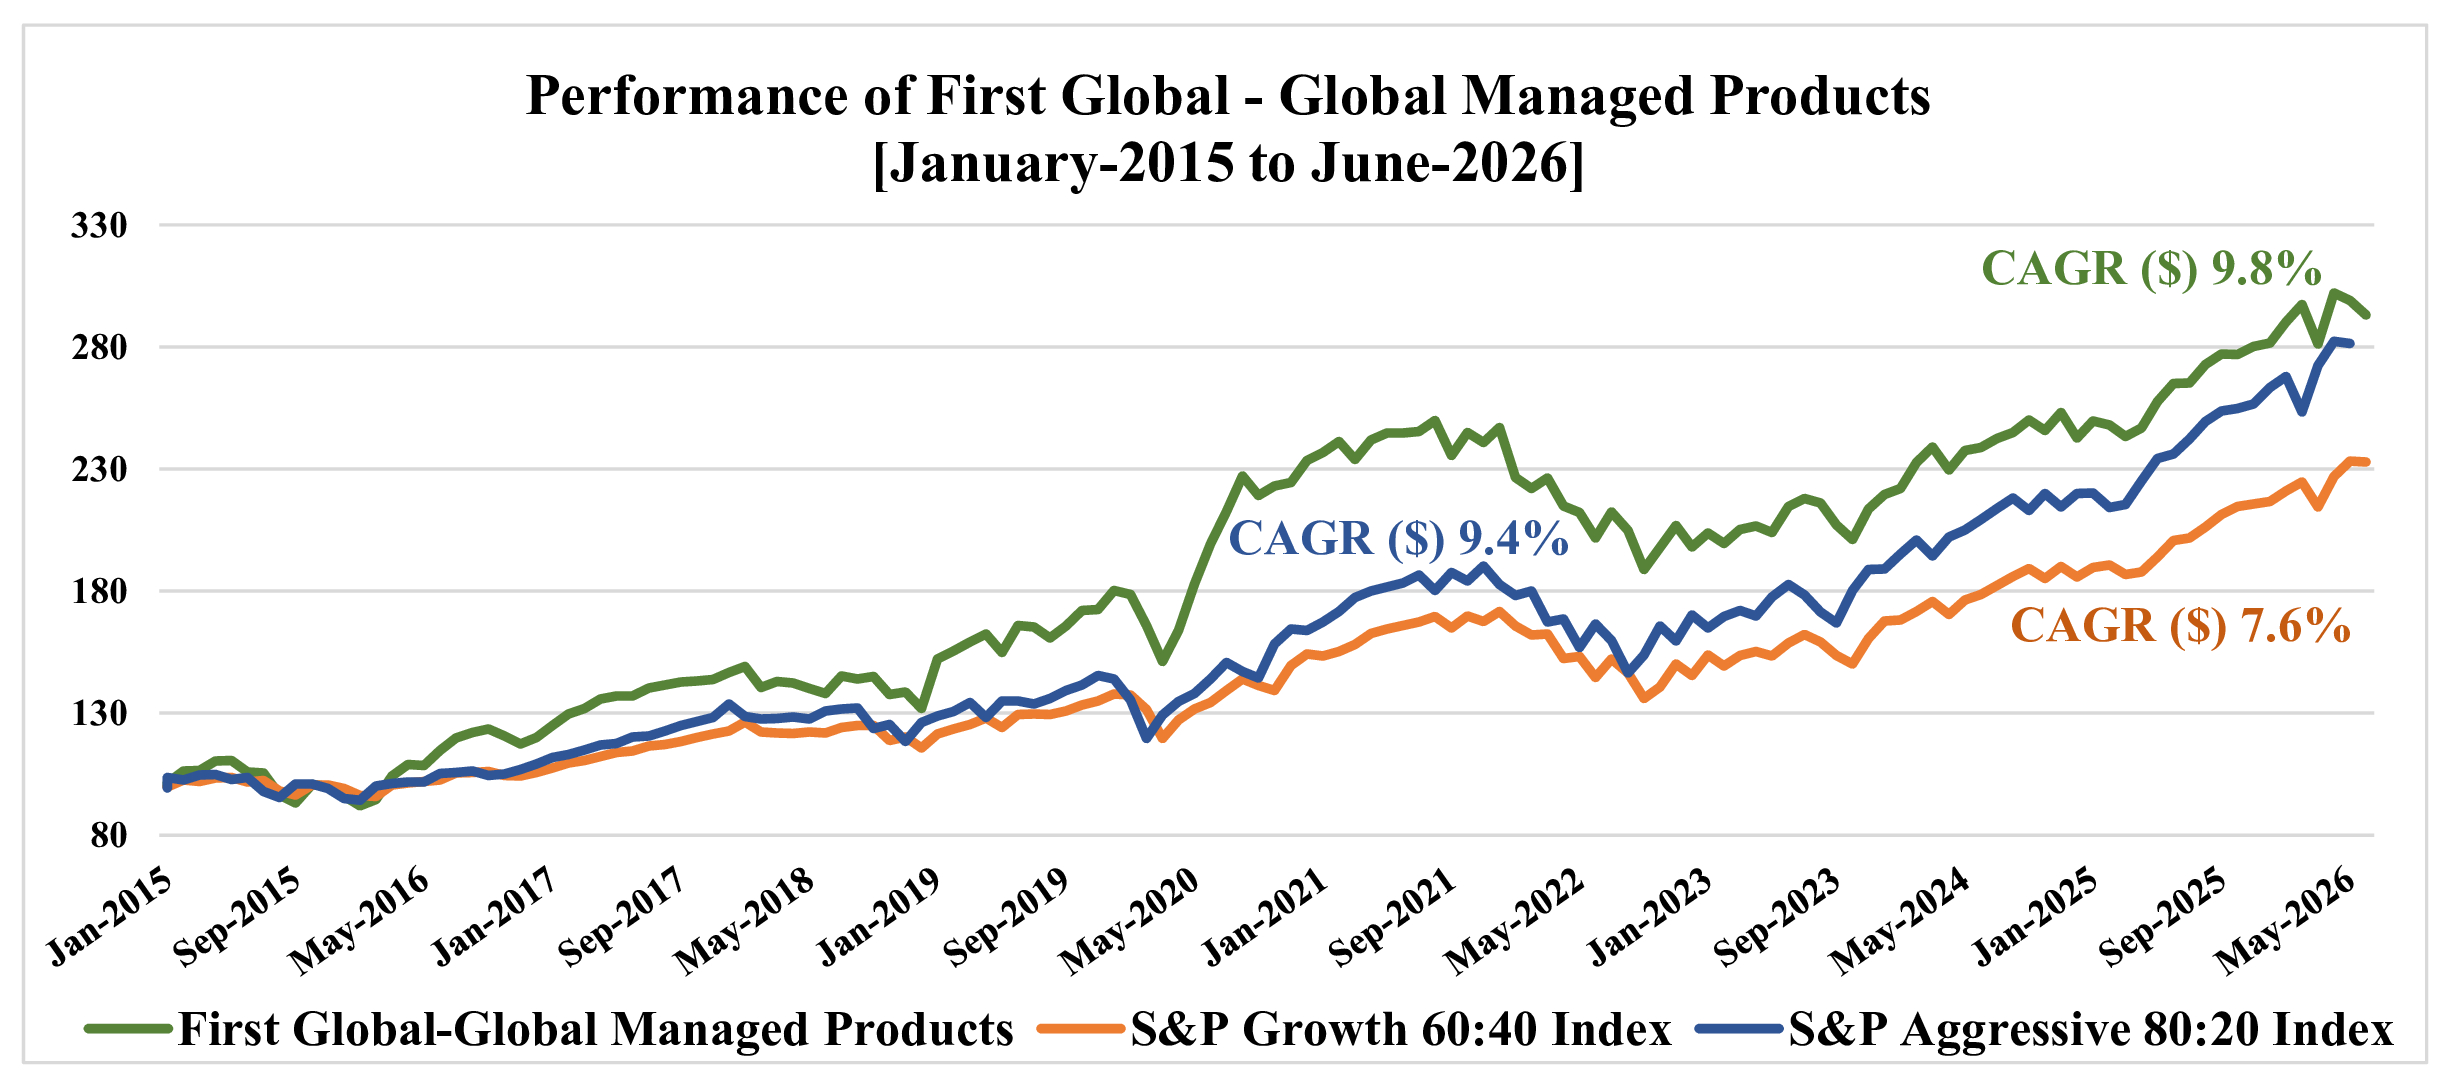
Indices Comparisons :-
References to market or composite indices, benchmarks, or other measures of relative market performance over a specified period of time are provided for information only. Reference or comparison to an index does not imply that the portfolio will be constructed in the same way as the index or achieve returns, volatility, or other results similar to the index.
Indices are unmanaged, include the reinvestment of dividends and do not reflect transaction costs or any performance fees. Unlike indices, the First Global-Global Managed Products will be actively managed and may include substantially fewer and different securities than those comprising each index. Results for the First Global-Global Managed Products as compared to the performance of Bloomberg Global EQ:FI 60:40 Index and Bloomberg Global EQ:FI 80:20 Index are for informational purposes only.
The Bloomberg Global EQ:FI 60:40 Index (ticker BMADM64) measure cross-asset market performance globally. The index rebalances monthly to 60% equities and 40% fixed income. The equities and fixed income are represented by Bloomberg Developed Markets Large & Mid Cap Total Return Index (ticker DMTR) and Bloomberg Global Aggregate Index (ticker LEGATRUU) respectively.
The Bloomberg Global EQ:FI 80:20 Index (ticker BMADM82) measure cross-asset market performance globally. The index rebalances monthly to 80% equities and 20% fixed income. The equities and fixed income are represented by Bloomberg Developed Markets Large & Mid Cap Total Return Index (ticker DMTR) and Bloomberg Global Aggregate Index (ticker LEGATRUU) respectively.
The investment program of First Global-Global Managed Products does not mirror the indices and the volatility may be materially different than the volatility of the indices.
Direct comparisons between the First Global-Global Managed Products' performance and the aforementioned indices are not without complications. First Global-Global Managed Products' portfolio may contain options and other derivative securities, fixed income investments, may include short sales of securities and margin trading and may not be as diversified as market indices. The indices may be unmanaged, may be market weighted, and unlike the fund, indices do not incur fees and expenses. Due to the differences among the portfolios of First Global-Global Managed Products and the aforementioned indices, no such index is directly comparable to First Global-Global Managed Products.
Performance Results :-
Performance results of First Global-Global Managed Products are presented for information purposes only and reflect the impact that material economic and market factors had on the manager’s decision-making process. No representation is being made that any investor or portfolio will or is likely to achieve profits or losses similar to those shown.
Performance results of First Global-Global Managed Products are net of fees and expenses to the investors; however, performance of individual investors may vary based upon differing management fee and incentive allocation arrangements, and the timing of contributions and withdrawals. Performance numbers were prepared by First Global (UK) Ltd. and have not been compiled, reviewed or audited by an independent accountant. The information provided is historical and is not a guide to future performance. Investors should be aware that a loss of investment is possible.
Performance results of First Global-Global Managed Products are net of all standard fees calculated at the highest rate charged, expenses and estimated incentive allocation. Returns are inclusive of the reinvestment of dividends and other earnings, including income from new issues. The return is based on monthly returns since inception and does not give effect to high water marks, if any. Returns may vary for investors who are restricted from participating in new issues.
This presentation cannot and does not guarantee or predict a similar outcome with respect to any future investment. First Global (UK) Ltd. makes no implications, warranties, promises, suggestions or guarantees whatsoever, in whole or in part, that by participating in any investment of or with First Global (UK) Ltd. you will experience similar investment results and earn any money whatsoever.
Graphs/Charts :-
The graphs, charts and other visual aids are provided for informational purposes only. None of these graphs, charts or visual aids can and of themselves be used to make investment decisions. No representation is made that these will assist any person in making investment decisions and no graph, chart or other visual aid can capture all factors and variables required in making such decisions.
Indices and Benchmarks Comparisons :-
References to market or composite indices, benchmarks, or other measures of relative market performance over a specified period of time are provided for information only. Reference or comparison to an index or a benchmark does not imply that the portfolio will be constructed in the same way as the index or achieve returns, volatility, or other results similar to the index.
Indices are unmanaged, include the reinvestment of dividends and do not reflect transaction costs or any performance fees. Unlike indices, the First Global India Super 50 will be actively managed and may include substantially fewer and different securities than those comprising each index. Results for the First Global India Super 50 as compared to the performance of Stallion Asset Core Fund, White Oak India Pioneers Equity Portfolio, NIFTY 500, Girik Capital, IIFL Multicap Advantage PMS, NIFTY 50, ASK Indian Entrepreneur Portfolio – IEP PMS, IIFL Multicap, ASK Investment Managers – Growth Portfolio, AXIS Brand Equity, Ambit Coffee CAN, Marcellus’ Consistent Compounders, Motilal Oswal Business Opportunities, Motilal Oswal Next Trillion Dollar Opportunity, ASK India Select Portfolio, Motilal Oswal Value, Axis Core and Satellite Portfolio, and Alchemy High Growth PMS (collectively, the “Multi-cap PMSes”) are for informational purposes only.
Stallion Asset Core Fund, White Oak India Pioneers Equity Portfolio, Girik Capital, IIFL Multicap Advantage PMS, ASK Indian Entrepreneur Portfolio – IEP PMS, IIFL Multicap, ASK Investment Managers – Growth Portfolio, AXIS Brand Equity, Ambit Coffee CAN, Marcellus’ Consistent Compounders, Motilal Oswal Business Opportunities, Motilal Oswal Next Trillion Dollar Opportunity, ASK India Select Portfolio, Motilal Oswal Value, Axis Core and Satellite Portfolio, and Alchemy High Growth PMS are each an India based privately owned portfolio management services.
NIFTY 500 is a stock market index of the Indian stock market which include the top 500 listed companies on the National Stock Exchange of India Limited, representing approximately 96.1 percent of free float market capitalization and approximately 96.5 percent of the total turnover on the exchange.
NIFTY 50 is a stock market index of the India stock market that represents the weighted average of 50 of the largest Indian companies listed on the National Stock Exchange of India Limited.
The investment program of First Global India Super 50 does not mirror the Multi-cap PMSes and the volatility may be materially different than the volatility of the Multi-cap PMSes.
Direct comparisons between the First Global India Super 50's performance and the Multi-cap PMSes are not without complications. First Global India Super 50's portfolio may contain options and fixed income investments and may be more diversified than the Multi-cap PMSes. Due to the differences among the portfolios of First Global India Super 50 and the Multi-cap PMSes, no such benchmark is directly comparable to First Global India Super 50.
Performance Results :-
Performance results of First Global India Super 50 are presented for information purposes only and reflect the impact that material economic and market factors had on the manager’s decision-making process. No representation is being made that any investor or portfolio will or is likely to achieve profits or losses similar to those shown.
Performance results of First Global India Super 50 are net of fees and expenses to the investors; however, performance of individual investors may vary based upon differing management fee and incentive allocation arrangements, and the timing of contributions and withdrawals. Performance numbers were prepared by First Global Finance Pvt. Ltd and have not been compiled, reviewed or audited by an independent accountant. The information provided is historical and is not a guide to future performance. Investors should be aware that a loss of investment is possible.
Performance results of First Global India Super 50 are net of all standard fees calculated at the highest rate charged, expenses and estimated incentive allocation. Returns are inclusive of the reinvestment of dividends and other earnings, including income from new issues. The return is based on annual returns since inception and does not give effect to high water marks, if any. Returns may vary for investors who are restricted from participating in new issues.
This presentation cannot and does not guarantee or predict a similar outcome with respect to any future investment. First Global Finance Pvt. Ltd makes no implications, warranties, promises, suggestions or guarantees whatsoever, in whole or in part, that by participating in any investment of or with First Global Finance Pvt. Ltd. you will experience similar investment results and earn any money whatsoever.
Graphs/Charts :-
The graphs, charts and other visual aids are provided for informational purposes only. None of these graphs, charts or visual aids can and of themselves be used to make investment decisions. No representation is made that these will assist any person in making investment decisions and no graph, chart or other visual aid can capture all factors and variables required in making such decisions.
Global Fixed Income PMS & Fund :-
Any projections, forecasts and estimates are necessarily speculative in nature and are based upon certain assumptions and based on current expectations and should not be considered definitive. In addition, matters describe are subject to known (and unknown) risks, uncertainties and other unpredictable factors, many of which are beyond the fund’s control. No representations or warranties are made as to the accuracy of such forward-looking statements. It can be expected that some or all of such forward-looking assumptions will not materialize or will vary significantly from actual results. Accordingly, any projections are only estimates and actual results will differ and may vary substantially from the projections or estimates shown.
Portfolio Management & Fund Management :-
Any projections, forecasts and estimates are necessarily speculative in nature and are based upon certain assumptions and based on current expectations and should not be considered definitive. In addition, matters describe are subject to known (and unknown) risks, uncertainties and other unpredictable factors, many of which are beyond the fund’s control. No representations or warranties are made as to the accuracy of such forward-looking statements. It can be expected that some or all of such forward-looking assumptions will not materialize or will vary significantly from actual results. Accordingly, any projections are only estimates and actual results will differ and may vary substantially from the projections or estimates shown.
Disclaimer #1:-
The information shown and any claimed performance is with respect to proprietary capital managed by First Global and is presented for information purposes only. The performance results were calculated gross of any fees, prepared internally, and have not been compiled, reviewed or audited by an independent accountant. The information provided is historical, and it is not a guide to future performance nor representative of every investment the portfolio made over the same period. Investors should be aware that a loss of investment is possible. No representation is being made that the portfolio will or is likely to achieve similar profits or losses.
Disclaimer #2:-
The returns on investment (“ROI”) shown for each asset were generated in proprietary capital managed by First Global and is presented for information purposes only. Additional information about the time periods and methods of calculation of the ROI for each asset are available upon request. The performance results were calculated gross of any fees, prepared internally, and have not been compiled, reviewed or audited by an independent accountant. The information provided is historical, and it is not a guide to future performance nor representative of every investment the portfolio made over the same period. Investors should be aware that a loss of investment is possible. No representation is being made that the portfolio will or is likely to achieve similar profits or losses.
Comparative Performance of FG – India Super 50 Versus other Multi-cap PMS Schemes:-
Refer to the disclaimers under “Comparative Performance of FG – India Super 50 Versus other Multi-cap PMS Schemes” above.
Indices Comparisons :-
References to market or composite indices, benchmarks, or other measures of relative market performance over a specified period of time are provided for information only. Reference or comparison to an index or a benchmark does not imply that the portfolio will be constructed in the same way as the index or achieve returns, volatility, or other results similar to the index.
Indices are unmanaged, include the reinvestment of dividends and do not reflect transaction costs or any performance fees. Unlike indices, the India Super 50 Portfolio will be actively managed and may include substantially fewer and different securities than those comprising each index. Results for the First Global India Super 50 Portfolio as compared to the performance of NIFTY 500 are for informational purposes only.
NIFTY 500 is a stock market index of the Indian stock market which include the top 500 listed companies on the National Stock Exchange of India Limited, representing approximately 96.1 percent of free float market capitalization and approximately 96.5 percent of the total turnover on the exchange.
The investment program of First Global India Super 50 Portfolio does not mirror NIFTY 500 and the volatility may be materially different than the volatility of the NIFTY 500
Direct comparisons between the First Global India Super 50 Portfolio's performance and NIFTY 500 are not without complications. First Global India Super 50 Portfolio may contain options, fixed income investments, and may be more diversified than NIFTY 500. Due to the differences among the portfolios of First Global India Super 50 Portfolio and NIFTY 500, no such benchmark is directly comparable to First Global India Super 50 Portfolio.
Performance Results :-
Performance results of First Global India Super 50 Portfolio are presented for information purposes only and reflect the impact that material economic and market factors had on the manager’s decision-making process. No representation is being made that any investor or portfolio will or is likely to achieve profits or losses similar to those shown.
Performance results of First Global India Super 50 Portfolio are net of fees and expenses to the investors; however, performance of individual investors may vary based upon differing management fee and incentive allocation arrangements, and the timing of contributions and withdrawals. Performance numbers were prepared by First Global Finance Pvt. Ltd. and have not been compiled, reviewed or audited by an independent accountant. The information provided is historical and is not a guide to future performance. Investors should be aware that a loss of investment is possible.
Performance results of First Global India Super 50 Portfolio are net of all standard fees calculated at the highest rate charged, expenses and estimated incentive allocation. Returns are inclusive of the reinvestment of dividends and other earnings, including income from new issues. The return is based on annual returns since inception and does not give effect to high water marks, if any. Returns may vary for investors who are restricted from participating in new issues.
This presentation cannot and does not guarantee or predict a similar outcome with respect to any future investment. First Global Finance Pvt. Ltd. makes no implications, warranties, promises, suggestions or guarantees whatsoever, in whole or in part, that by participating in any investment of or with First Global Finance Pvt. Ltd. you will experience similar investment results and earn any money whatsoever.
Graphs/Charts :-
The graphs, charts and other visual aids are provided for informational purposes only. None of these graphs, charts or visual aids can and of themselves be used to make investment decisions. No representation is made that these will assist any person in making investment decisions and no graph, chart or other visual aid can capture all factors and variables required in making such decisions.
Indices Comparisons :-
References to market or composite indices, benchmarks, or other measures of relative market performance over a specified period of time are provided for information only. Reference or comparison to an index or a benchmark does not imply that the portfolio will be constructed in the same way as the index or achieve returns, volatility, or other results similar to the index.
Indices are unmanaged, include the reinvestment of dividends and do not reflect transaction costs or any performance fees. Unlike indices, the India Multi-Asset Allocation Portfolio will be actively managed and may include substantially fewer and different securities than those comprising each index. Results for the India Multi-Asset Allocation Portfolio as compared to the performance of CRISIL Hybrid 50+50 Moderate Index are for informational purposes only.
CRISIL Hybrid 50+50 Moderate Index is an index that track the performance of a hybrid portfolio having a blend of S&P BSE 200 (50%) and CRISIL Composite Bond Fund Index (50%). The S&P BSE 200 Index is designed to measure the performance of the top 200 companies listed at Bombay Stock Exchange, based on size and liquidity across sectors. The CRISIL Composite Bond Fund Index seeks to track the performance of a debt portfolio that includes government securities and AAA/AA+/AA rated corporate bonds.
The investment program of India Multi-Asset Allocation Portfolio does not mirror CRISIL Hybrid 50+50 Moderate Index and the volatility may be materially different than the volatility of the CRISIL Hybrid 50+50 Moderate Index.
Direct comparisons between the India Multi-Asset Allocation Portfolio's performance and CRISIL Hybrid 50+50 Moderate Index are not without complications. India Multi-Asset Allocation Portfolio may contain options, fixed income investments, and may not be as diversified as CRISIL Hybrid 50_50 Moderate Index. Due to the differences among the portfolios of India Multi-Asset Allocation Portfolio and CRISIL Hybrid 50+50 Moderate Index, no such benchmark is directly comparable to India Multi-Asset Allocation Portfolio.
Performance Results :-
Performance results of India Multi-Asset Allocation Portfolio are presented for information purposes only and reflect the impact that material economic and market factors had on the manager’s decision-making process. No representation is being made that any investor or portfolio will or is likely to achieve profits or losses similar to those shown.
Performance results of India Multi-Asset Allocation Portfolio are net of fees and expenses to the investors; however, performance of individual investors may vary based upon differing management fee and incentive allocation arrangements, and the timing of contributions and withdrawals. Performance numbers were prepared by First Global Finance Pvt. Ltd. and have not been compiled, reviewed or audited by an independent accountant. The information provided is historical and is not a guide to future performance. Investors should be aware that a loss of investment is possible.
Performance results of India Multi-Asset Allocation Portfolio are net of all standard fees calculated at the highest rate charged, expenses and estimated incentive allocation. Returns are inclusive of the reinvestment of dividends and other earnings, including income from new issues. The return is based on annual returns since inception and does not give effect to high water marks, if any. Returns may vary for investors who are restricted from participating in new issues.
This presentation cannot and does not guarantee or predict a similar outcome with respect to any future investment. First Global Finance Pvt. Ltd. makes no implications, warranties, promises, suggestions or guarantees whatsoever, in whole or in part, that by participating in any investment of or with First Global Finance Pvt. Ltd. you will experience similar investment results and earn any money whatsoever.
Graphs/Charts :-
The graphs, charts and other visual aids are provided for informational purposes only. None of these graphs, charts or visual aids can and of themselves be used to make investment decisions. No representation is made that these will assist any person in making investment decisions and no graph, chart or other visual aid can capture all factors and variables required in making such decisions.
FG-Global Freedom Fund (FG-GFF) / FG-Global Multi Asset Allocation Portfolio (FG-GMAAP)
Indices Comparisons :-
References to market or composite indices, benchmarks, or other measures of relative market performance over a specified period of time are provided for information only. Reference or comparison to an index does not imply that the portfolio will be constructed in the same way as the index or achieve returns, volatility, or other results similar to the index.
Indices are unmanaged, include the reinvestment of dividends and do not reflect transaction costs or any performance fees. Unlike indices, the FG-Global Freedom Fund (“FG-GFF”) and FG-Global Multi Asset Allocation Portfolio (“FG-GMAAP”) will be actively managed and may include substantially fewer and different securities than those comprising each index. Results for the FG-GFF and GF-GMAAP as compared to the performance of Bloomberg Global EQ:FI 60:40 Index and Bloomberg Global EQ:FI 80:20 Index (ticker BMADM82) are for informational purposes only.
The Bloomberg Global EQ:FI 60:40 Index (ticker BMADM64) measure cross-asset market performance globally. The index rebalances monthly to 60% equities and 40% fixed income. The equities and fixed income are represented by Bloomberg Developed Markets Large & Mid Cap Total Return Index (ticker DMTR) and Bloomberg Global Aggregate Index (ticker LEGATRUU) respectively.
The Bloomberg Global EQ:FI 80:20 Index (ticker BMADM82) measure cross-asset market performance globally. The index rebalances monthly to 80% equities and 20% fixed income. The equities and fixed income are represented by Bloomberg Developed Markets Large & Mid Cap Total Return Index (ticker DMTR) and Bloomberg Global Aggregate Index (ticker LEGATRUU) respectively.
The investment programs of FG-GFF and FG-GMAAP do not mirror the indices and the volatility may be materially different than the volatility of the indices.
Direct comparisons between FG-GFF and FG-GMAAP's performance and the aforementioned indices are not without complications. FG-GFF and FG-GMAAP's portfolios may contain options and other derivative securities, fixed income investments, may include short sales of securities and margin trading and may not be as diversified as market indices. The indices may be unmanaged, may be market weighted, and unlike the fund, indices do not incur fees and expenses. Due to the differences among the portfolios of FG-GFF, FG-GMAAP, and the aforementioned indices, no such index is directly comparable to FG-GFF or FG-GMAAP.
Performance Results :-
Performance results of FG-GFF and FG-GMAAP are presented for information purposes only and reflect the impact that material economic and market factors had on the manager’s decision-making process. No representation is being made that any investor or portfolio will or is likely to achieve profits or losses similar to those shown.
Performance results of FG-GFF and FG-GMAAP are net of fees and expenses to the investors; however, performance of individual investors may vary based upon differing management fee and incentive allocation arrangements, and the timing of contributions and withdrawals. Performance numbers were prepared by First Global (UK) Ltd. and have not been compiled, reviewed or audited by an independent accountant. The information provided is historical and is not a guide to future performance. Investors should be aware that a loss of investment is possible.
Performance results of FG-GFF and FG-GMAAP are net of all standard fees calculated at the highest rate charged, expenses and estimated incentive allocation. Returns are inclusive of the reinvestment of dividends and other earnings, including income from new issues. The return is based on monthly returns since inception and does not give effect to high water marks, if any. Returns may vary for investors who are restricted from participating in new issues.
This presentation cannot and does not guarantee or predict a similar outcome with respect to any future investment. First Global (UK) Ltd. makes no implications, warranties, promises, suggestions or guarantees whatsoever, in whole or in part, that by participating in any investment of or with First Global (UK) Ltd. you will experience similar investment results and earn any money whatsoever.
Graphs/Charts :-
The graphs, charts and other visual aids are provided for informational purposes only. None of these graphs, charts or visual aids can and of themselves be used to make investment decisions. No representation is made that these will assist any person in making investment decisions and no graph, chart or other visual aid can capture all factors and variables required in making such decisions.
Indices Comparisons :-
References to market or composite indices, benchmarks, or other measures of relative market performance over a specified period of time are provided for information only. Reference or comparison to an index does not imply that the portfolio will be constructed in the same way as the index or achieve returns, volatility, or other results similar to the index.
Indices are unmanaged, include the reinvestment of dividends and do not reflect transaction costs or any performance fees. Unlike indices, the Global Fixed Income Portfolio will be actively managed and may include substantially fewer and different securities than those comprising each index. Results for the Global Fixed Income Portfolio as compared to the performance of Bloomberg Barclays Multiverse Index are for informational purposes only.
The Bloombger Barclays Multiverse Index (ticker LF93TRUU) provides a broad based measure of the global fixed income bond market. The index is a union of the Global Aggregate Index, the Global High-Yield Index, the Euro Treasury High Yield Index, and captures EM Local Currency Debt not already included in the Global Aggregate Index.
The investment program of the Global Fixed Income Portfolio does not mirror the indices and the volatility may be materially different than the volatility of the indices.
Direct comparisons between the Global Fixed Income Portfolio's performance and the Bloomberg Barclays Multiverse Index are not without complications. Global Fixed Income Portfolio may contain options and other derivative securities, fixed income investments, may include short sales of securities and margin trading and may not be as diversified as market indices. The indices may be unmanaged, may be market weighted, and unlike the fund, indices do not incur fees and expenses. Due to the differences among the portfolios of Global Fixed Income Portfolio and the Bloomberg Barclays Multiverse Index, no such index is directly comparable to Global Fixed Income Portfolio.
Performance Results :-
Performance results of Global Fixed Income Portfolio are presented for information purposes only and reflect the impact that material economic and market factors had on the manager’s decision-making process. No representation is being made that any investor or portfolio will or is likely to achieve profits or losses similar to those shown.
Performance results of Global Fixed Income Portfolio are net of fees and expenses to the investors; however, performance of individual investors may vary based upon differing management fee and incentive allocation arrangements, and the timing of contributions and withdrawals. Performance numbers were prepared by First Global (UK) Ltd. and have not been compiled, reviewed or audited by an independent accountant. The information provided is historical and is not a guide to future performance. Investors should be aware that a loss of investment is possible.
Performance results of Global Fixed Income Portfolio are net of all standard fees calculated at the highest rate charged, expenses and estimated incentive allocation. Returns are inclusive of the reinvestment of dividends and other earnings, including income from new issues. The return is based on monthly returns since inception and does not give effect to high water marks, if any. Returns may vary for investors who are restricted from participating in new issues.
This presentation cannot and does not guarantee or predict a similar outcome with respect to any future investment. First Global (UK) Ltd. makes no implications, warranties, promises, suggestions or guarantees whatsoever, in whole or in part, that by participating in any investment of or with First Global (UK) Ltd. you will experience similar investment results and earn any money whatsoever.
Graphs/Charts :-
The graphs, charts and other visual aids are provided for informational purposes only. None of these graphs, charts or visual aids can and of themselves be used to make investment decisions. No representation is made that these will assist any person in making investment decisions and no graph, chart or other visual aid can capture all factors and variables required in making such decisions.
Indices Comparisons :-
References to market or composite indices, benchmarks, or other measures of relative market performance over a specified period of time are provided for information only. Reference or comparison to an index does not imply that the portfolio will be constructed in the same way as the index or achieve returns, volatility, or other results similar to the index.
Indices are unmanaged, include the reinvestment of dividends and do not reflect transaction costs or any performance fees. Unlike indices, the First Global Human + Machine Model will be actively managed and may include substantially fewer and different securities than those comprising each index. Results for the First Global Human + Machine Model as compared to the performance of NIFTY 50, NIFTY 500, and Bank Nifty are for informational purposes only.
NIFTY 50 is a stock market index of the India stock market that represents the weighted average of 50 of the largest Indian companies listed on the National Stock Exchange of India Limited.
NIFTY 500 is a stock market index of the Indian stock market which include the top 500 listed companies on the National Stock Exchange of India Limited, representing approximately 96.1 percent of free float market capitalization and approximately 96.5 percent of the total turnover on the exchange.
Bank Nifty represents the 12 most liquid and large capitalized stocks from the banking sector which trade on the National Stock Exchange of India Limited.
The investment program of First Global Human + Machine Model does not mirror the indices and the volatility may be materially different than the volatility of the indices.
Direct comparisons between the First Global Human + Machine Model's performance and the aforementioned indices are not without complications. First Global Human + Machine Model's portfolio may contain options and may not be as diversified as market indices. The indices may be unmanaged, may be market weighted, and unlike the fund, indices do not incur fees and expenses. Due to the differences among the portfolios of First Global Human + Machine Model and the aforementioned indices, no such index is directly comparable to First Global Human + Machine Model.
Performance Results :-
Performance results of First Global Human + Machine Model are presented for information purposes only and reflect the impact that material economic and market factors had on the manager’s decision-making process. No representation is being made that any investor or portfolio will or is likely to achieve profits or losses similar to those shown.
Performance results of First Global Human + Machine Model are net of fees and expenses to the investors; however, performance of individual investors may vary based upon differing management fee and incentive allocation arrangements, and the timing of contributions and withdrawals. Performance numbers were prepared by First Global (UK) Ltd. and have not been compiled, reviewed or audited by an independent accountant. The information provided is historical and is not a guide to future performance. Investors should be aware that a loss of investment is possible.
Performance results of First Global Human + Machine Model are net of all standard fees calculated at the highest rate charged, expenses and estimated incentive allocation. Returns are inclusive of the reinvestment of dividends and other earnings, including income from new issues. The return is based on monthly returns since inception and does not give effect to high water marks, if any. Returns may vary for investors who are restricted from participating in new issues.
This presentation cannot and does not guarantee or predict a similar outcome with respect to any future investment. First Global (UK) Ltd. makes no implications, warranties, promises, suggestions or guarantees whatsoever, in whole or in part, that by participating in any investment of or with First Global (UK) Ltd. you will experience similar investment results and earn any money whatsoever.
Graphs/Charts :-
The graphs, charts and other visual aids are provided for informational purposes only. None of these graphs, charts or visual aids can and of themselves be used to make investment decisions. No representation is made that these will assist any person in making investment decisions and no graph, chart or other visual aid can capture all factors and variables required in making such decisions.