Without getting into a long preamble, we invite you to take a look at the data below, which clearly shows you the returns of the various Mutual Funds and PMS Providers, but most importantly they show you where the returns are coming from: Higher Risk or Higher Skill.
Stories can take us only upto a point and fund managers are great storytellers as we all know.
But ultimately it is only data and data alone that matters when it comes to money.
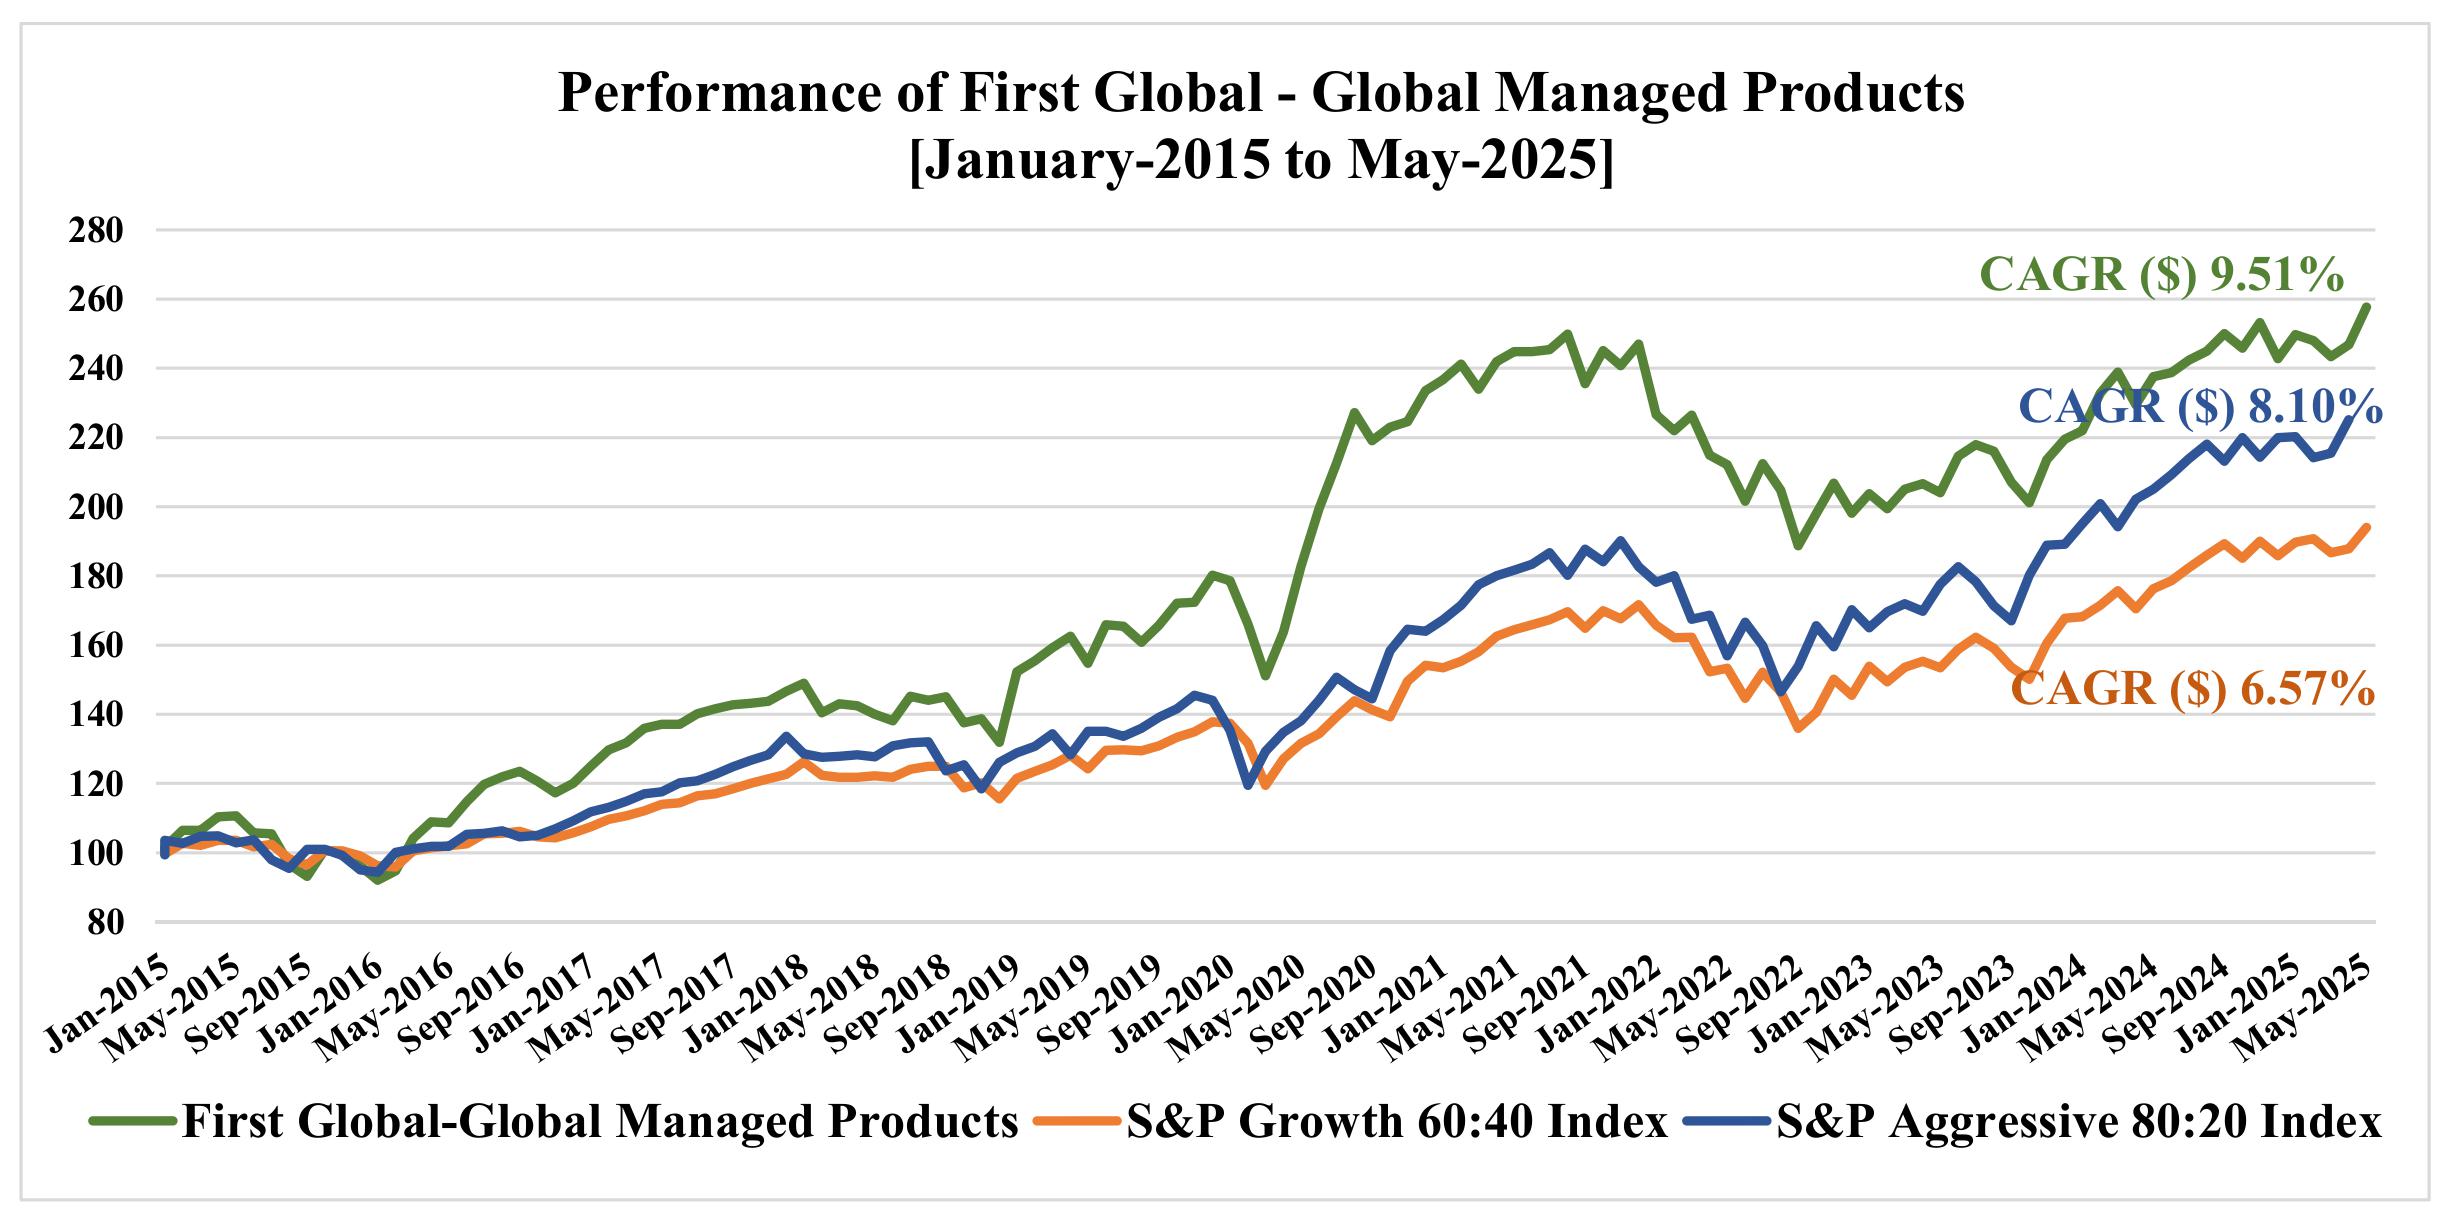
The data below shows clearly that we, at FG, are delivering not just far ‘ahead of market’ returns, but also that these returns are coming with far lower risk, as compared to the market and the major peer group.
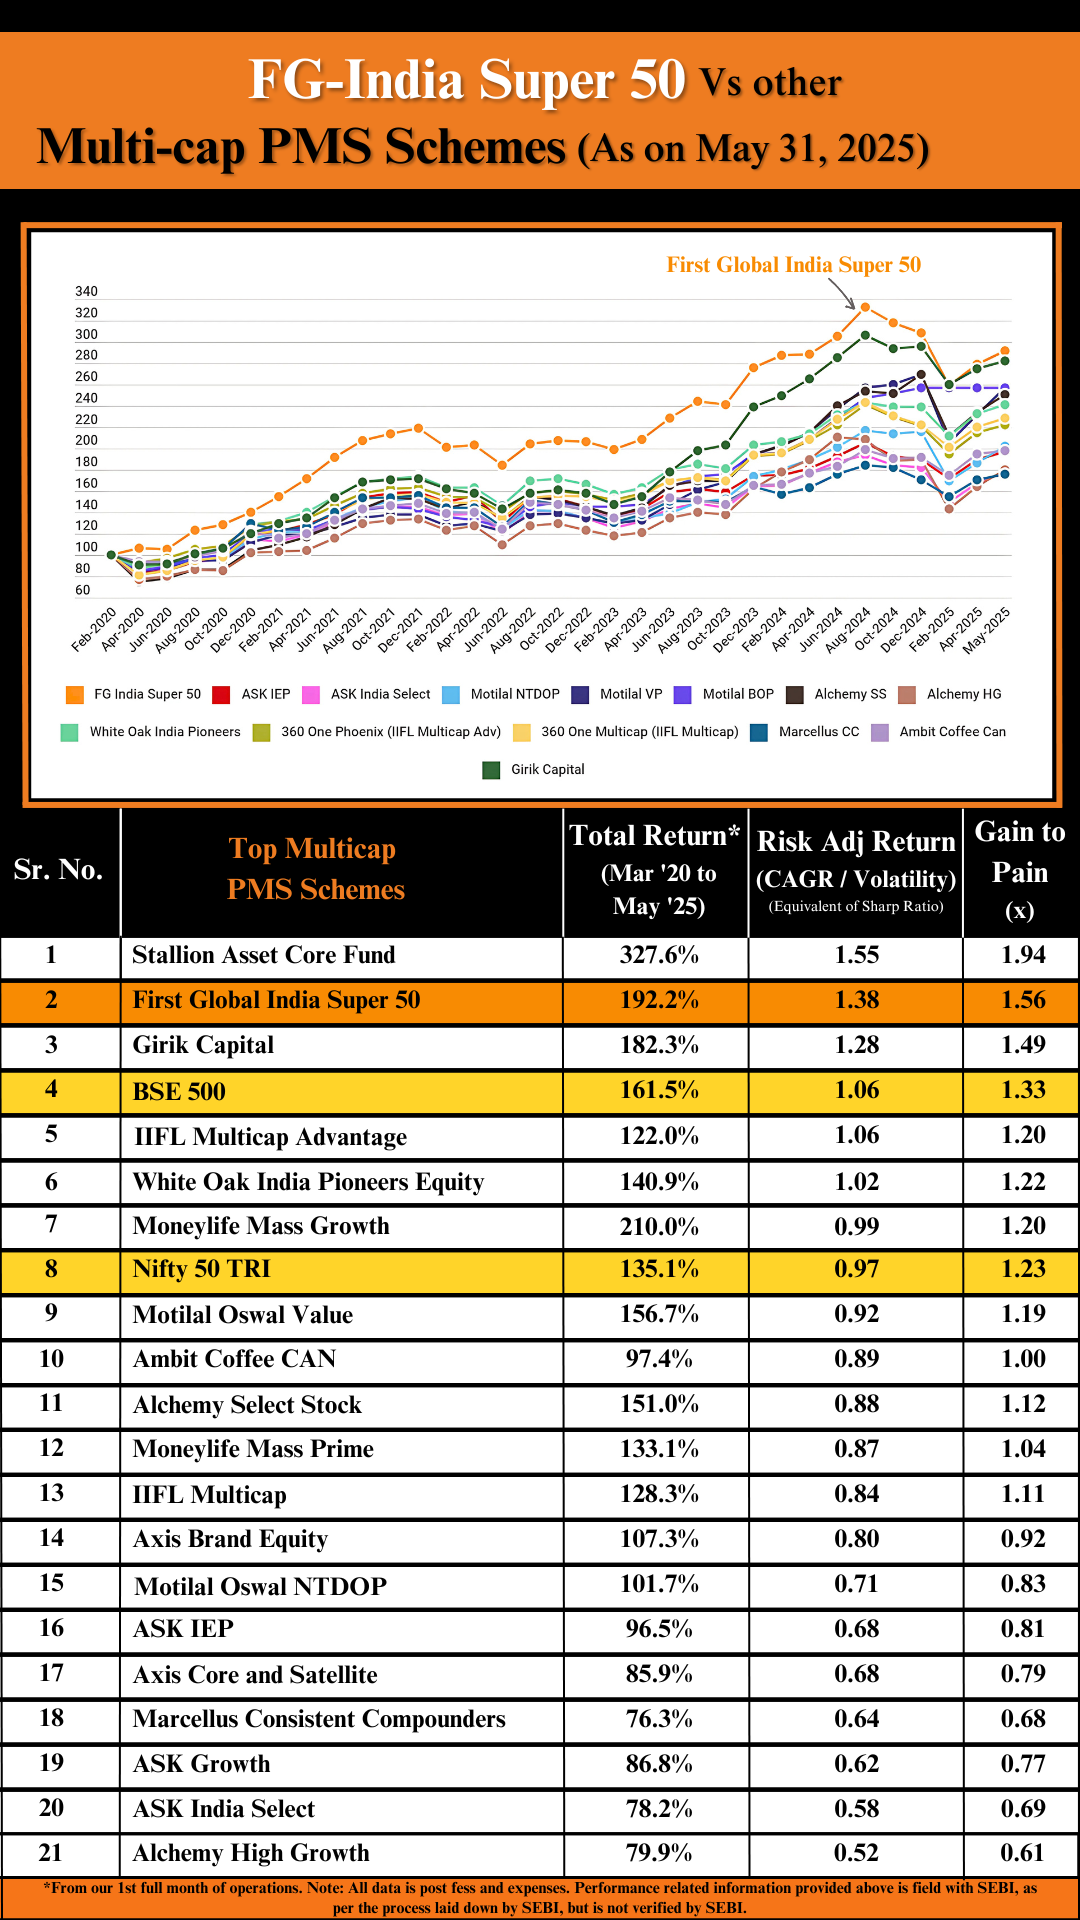
A] Comparison of First Global-Indian Super 50 PMS Scheme with various Multicap PMS schemes on various Performance parameters (Small Caps are just 10% of our allocation)
|
Sr No. |
Multicap PMS Scheme |
Apr'21 |
CYTD |
Total Return (Mar'20-Apr'21) |
CAGR since (Mar'20-Apr'21) |
Risk/ Volatility |
Risk Adj Return (x) |
Gain To Pain Ratio (x) |
|
1 |
FG’s India Super 50 |
9.00% |
22.50% |
72.10% |
59.30% |
20.70% |
2.86 |
4.02 |
|
2 |
Stallion Asset Core Fund |
2.20% |
9.40% |
49.80% |
41.40% |
28.30% |
1.46 |
1.78 |
|
3 |
White Oak India Pioneers Equity |
1.80% |
9.20% |
40.30% |
33.70% |
28.50% |
1.18 |
1.49 |
|
4 |
Girik Capital |
5.60% |
12.00% |
34.50% |
28.90% |
22.80% |
1.27 |
1.43 |
|
5 |
IIFL Multicap Advantage |
2.30% |
5.70% |
34.00% |
28.50% |
21.20% |
1.35 |
1.76 |
|
6 |
ASK IEP |
1.30% |
7.70% |
27.90% |
23.50% |
31.70% |
0.74 |
0.92 |
|
7 |
ASK Growth |
2.60% |
10.50% |
27.50% |
23.10% |
30.40% |
0.76 |
0.97 |
|
8 |
Marcellus Consistent Compounders |
-0.10% |
-2.30% |
26.10% |
22.00% |
23.60% |
0.93 |
1.06 |
|
9 |
IIFL Multicap |
1.90% |
5.70% |
26.00% |
21.90% |
35.30% |
0.62 |
0.94 |
|
10 |
Axis Brand Equity |
-1.10% |
3.00% |
25.00% |
21.10% |
28.30% |
0.74 |
0.91 |
|
11 |
Motilal Oswal BOP |
-2.40% |
1.80% |
23.40% |
19.70% |
28.80% |
0.68 |
0.89 |
|
12 |
Motilal Oswal NTDOP |
-0.90% |
6.80% |
22.60% |
19.10% |
30.00% |
0.64 |
0.88 |
|
13 |
Moneylife Mass Prime |
5.00% |
6.10% |
19.40% |
16.40% |
30.10% |
0.55 |
0.83 |
|
14 |
ASK India Select |
1.90% |
3.80% |
18.80% |
15.90% |
29.40% |
0.54 |
0.7 |
|
15 |
Alchemy Select Stock |
4.70% |
12.40% |
16.50% |
14.00% |
34.40% |
0.41 |
0.69 |
|
16 |
Axis core and satellite |
-1.40% |
2.60% |
16.20% |
13.80% |
27.60% |
0.5 |
0.64 |
|
17 |
Alchemy High Growth |
0.30% |
2.60% |
4.60% |
4.00% |
31.60% |
0.13 |
0.31 |
|
|
Nifty 500 |
0.50% |
7.60% |
35.50% |
29. 8% |
30.70% |
0.97 |
1.29 |
|
|
Nifty 50 |
-0.40% |
6.20% |
32.60% |
27.30% |
30.00% |
0.91 |
1.19 |
B] Comparison of First Global-Indian Super 50 PMS Scheme with various top Multicap Mutual Funds on various Performance parameters
|
Sr No. |
Multi Cap Equity Mutual Funds |
Apr'21 |
CYTD |
Total Return (Mar'20-Apr'21) |
CAGR since (Mar'20-Apr'21) |
Risk/ Volatility |
Risk Adj Return (x) |
Gain To Pain Ratio (x) |
|
1 |
FG’s India Super 50 |
9.00% |
22.50% |
72.10% |
59.30% |
20.70% |
2.86 |
4.02 |
|
2 |
Nippon India Multi Cap Fund |
0.00% |
15.30% |
22.50% |
19.00% |
38.70% |
0.49 |
0.71 |
|
3 |
ICICI Prudential Multicap Fund |
0.50% |
10.20% |
31.00% |
26.00% |
32.70% |
0.79 |
1.07 |
|
4 |
Axis Capital Builder Fund |
0.60% |
5.70% |
27.50% |
23.20% |
29.50% |
0.79 |
0.96 |
|
5 |
Invesco India Multicap Fund |
1.50% |
10.10% |
30.10% |
25.30% |
32.10% |
0.79 |
1.15 |
|
6 |
Baroda Multicap Fund |
2.10% |
11.00% |
36.90% |
30.90% |
28.20% |
1.1 |
1.38 |
|
7 |
Nippon India India Opportunities Fund |
0.40% |
11.20% |
25.20% |
21.30% |
38.40% |
0.55 |
0.76 |
|
8 |
Principal Multi Cap Growth Fund |
0.40% |
9.30% |
29.90% |
25.10% |
29.80% |
0.84 |
1.16 |
|
9 |
Sundaram Equity Fund |
0.70% |
10.50% |
31.00% |
26.10% |
31.10% |
0.84 |
1.2 |
What do these ratios signify?
Let us break it down for you in the most simplest of language:
(For those interested, the formulae used for all the calculations are given at the end of the blog)
1. Volatility or Risk: The Volatility or Risk of a portfolio of stocks is a measure of how wildly the total value of all the stocks in that portfolio varies. A portfolio's volatility is calculated by calculating the standard deviation of the entire portfolio's returns.
As is clear from the table above, the Volatility of our portfolio is very low compared to our peers as well as when compared with the markets.
The volatility of our returns is the lowest in the whole market. It is one third below the market volatility and as the next calculation shows it is even lower as a proportion of returns we have generated.
2. The Risk Adjusted Return (RAR) compares the portfolio’s return versus the standard deviation of returns. It is calculated by dividing the Annualized returns by the Annualized Volatility.
It captures the amount of returns for each unit of risk.
For First Global this ratio is 2.86 as against 0.9 for the market.
More to the point there is no other PMS or Mutual Fund that has reached the value of 2.5, 2 or even 1.5 clearly showing that not only have we got the highest returns in the market for our investors, these returns have come at very very low volatility and risk. The returns per unit of risk are double of the next best player and nearly three times the value for the market.
3. Gain to Pain ratio: This is one of the best measures of return and risk profile of any fund.
The formula to calculate this ratio is: Total Returns ÷ Absolute value of negative returns.
So, the numerator is the sum of all monthly returns, positive and negative through the year. The denominator is the absolute value of the negative returns, for the months when the returns were negative.
We illustrate this through a simple example
|
|
Jan |
Feb |
Mar |
Apr |
May |
June |
July |
Aug |
Sep |
Oct |
Nov |
Dec |
|
Returns (%) |
5% |
-3% |
-3% |
4% |
5% |
6% |
7% |
8% |
10% |
10% |
-5% |
6% |
The sum of all Monthly Returns is 50.0
The absolute value of all return deficits (-3.0, -3.0, -5.00) is -11.00
The Fund's Gain to Pain Ratio is 50.0/11.0= 4.54
Our Gain to Pain ratio at over 4 is way ahead of other PMSes and funds, none of which are at 4, 3 or even 2. The market's gain to pain is a measly 1.3
This our returns have come with minimal pain or minimal drawdowns.
The reason for First Global's performance with higher returns and lower risk on all measures are not because of some great magic!
It is because of using some of the most advanced investment analysis technologies known to man, and building an investment tech stack, our FG ExoTech, that reduces the role of luck and increases the role of skill dramatically.
Do you want your fund managers to be relying on their luck or on genuine skill? We think the answer is clear.
The above data shows you where the skill is.
We look forward to being partners in your wealth creation journey.
Ratio Calculation Details
Sample Variance Calculation
Let us consider the Monthly returns of a PMS fund over a 1 year period.
|
Jan |
Feb |
Mar |
Apr |
May |
June |
July |
Aug |
Sep |
Oct |
Nov |
Dec |
|
|
Returns (%) |
5% |
3% |
3% |
4% |
5% |
6% |
7% |
8% |
10% |
10% |
5% |
6% |
|
% Deviation = Return -Mean |
-1.0% |
-3.0% |
-3.0% |
-2.0% |
-1.0% |
0.0% |
1.0% |
2.0% |
4.0% |
4.0% |
-1.0% |
0.0% |
|
Squares of Deviation |
1% |
9% |
9% |
4% |
1% |
0% |
1% |
4% |
16% |
16% |
1% |
0% |
Mean=Total Returns/12=72/12=6%
Variance=Total of the Squares of Deviation of all months/12=62/12=5.17
Monthly Standard Deviation=Square root of Variance =2.27
Annualized Std. Deviation=2.27*Square Root of 12="2.27*3.46=7.86%
Hence, Annualised Volatility=Annualised" Std Deviation=7.86%
Sample calculation of Risk Adjusted Returns (RAR)
RAR formula = Return on Portfolio ÷ Standard deviation
For example if the return is 12% with 10% standard deviation, then RAR = 12÷10 = 1.2
From the desk of
Devina Mehra
If you want any help at all in your wealth creation journey, in managing your Investments, just drop us a line via this link and we will be right by your side, super quick!
Or WhatsApp us on +91 88501 69753
Chat soon!

Economists Think Dollar's Fall May Explain the Recent ‘Rally’ by Steve Liesman
Einstein taught us about relativity in nature. Now come Devina Mehra and Shankar Sharma of First Global to teach us about relativity in financial markets -- and raise some serious questions about just what is driving stock prices.
First Global reports are quite credible and, on occasion, more than that.
What prompts this mention is Intel's earnings report and the fact that First Global has had a pretty good bead on the company and its stock.

AMD up again following First Global upgrade to ‘buy’ (AMD) By Tomi Kilgore
Analyst Kuldeep Koul at First Global upgraded Advanced Micro Devices (AMD) to "buy" from "outperform," given the "exceptional traction" that the chipmaker's Opteron line of processors has been able to get.

Baidu Climbs on First Global’s ‘Outperform’ Outlook
Baidu Inc., the operator of China’s most-used Internet search engine, rose to the highest price in two weeks after First Global rated the shares “outperform? in new coverage.

Personality counts: Walmart's frugal, but Target charms
"It's better to take a slight hit on [profit] margins and keep on moving and inventing," says First Global Securities. And at least for now, Target is inventing in a way that appeals to consumers with money to spend.

Dead Batteries
At 11 times trailing earnings, Energizer is cheaper; Gillette's multiple is 25. But cheaper doesn't mean better, says First Global.

Bipinchandra Dugam @bipinchandra90
@devinamehra @firtglobalsec
invested in both GFF-GTS and Super I50. Thank you very much for such wonderful investing experience with completely new approach. In my 15years of investing first product I felt which close to what customer want.

Shishir Kapadia @shishirkapadia1
@firstglobalsec @devinamehra
by far you are the best, I have not come across transparency, acumen, global expertise, exposure, protection of capital, delivering return from any fund/ fund managers. Invested very small size in 3 products will keep on increasing it over the period

Piyush Bhargava @PiyushB88762654
@devinamehra @firstglobalsec
Thanks you team FG specially Devina, my investment doubled in less than 3 years in SDPB As a investors & PMS distributor of your product looking to have a long-term relationship with the company.
@KarmathNaveen the person with whom I always interact

Sumeet Goel @GoelSumeet
Very happy & relaxed to be invested with first global pms

Shishir Kapadia@shishirkapadia1
Congratulations on super performance, above all transparency and systematic process are unmatchable.
One must opt this, if person consider him/her self as an investor. Very happy to be part of this since invested. FG has managed worst year (ie 2022) so efficiently and skillfully.

SY @SachinY95185924
With so much of volatility in the market, risk management is very important part & considering that FG is doing awesome work!!! Kudos to you Chief

Amit Shukla @amitTalksHere
Truly outstanding. As a retail subscriber to #fghum #smallcase, I can vouch for the Nifty beating returns (8% vs 3%) in last 1 year. Keep up the awesome work @firstglobalsec
We can load above testimonials on site as a scroller, and just below that we can add a section for compliments . Below tweets are comments and praises are related to our content, performance and some our direct compliments to you.

ADIT PATEL @ADITPAT11226924
Good team...
Special mention @KarmathNaveen .. he is soo helpful anytime of the day or night..

Hindustani @highmettle
Bought Peace with FG-Hum.Moving all funds from DIY investing to well managed and diversified PF at low cost.
It has doubled almost, excellent pick.Every small investor must invest in her FG-HUM Smallcase.

Suresh Nair @Suresh_Nair_23
I have 8 small cases and your has been the most rewarding ones .. thank you Devina.

Sayed Masood @SayedM375
There is absolutely no doubt that she is one of the best investors of India in modern times but more importantly, she shares the most sincere and sane advice with retail investors.
SY @SachinY95185924
Wow Superb Returns🔥 Congratulations Chief for being Number 1 among all PMS!!!
You are one of the sharpest mind in Global Stock Market

AnupamM @moitraanupam
Congratulations Devina, results talk in itself!

Abhishek @simplyabhi21
Congratulations ma’am @devinamehra ! The consistency you have in maintaining the top rank position is outstanding! 👏

Mihir Shah @Mihir41Shah
We are learning More about markets (& Life ) thanks to U than we learnt in our Professional courses.A BIg Thank You, Wish all get Teachers Like You!!

Sumit Sharma @MediaSumit
"The ability to be comfortable with being outside consensus is a superpower in investing...and in life." Devina ji hits the nail on its head!

Majid Ahamed @MajidAhamed1
Congratulations @devinamehra mam! All the best for long term returns as well.

Vinay Kumar @VinayKu05949123
This is the wonderful session I have ever attended till date. One of the most fruitful hour of my life. Devina madam, ur clarity on financial mkts is simply superb.The way u portray the facts supported by "data" about stock mkts is really astonishing.I will listen again.Thanks.

VIJAY @drippingashes
I loved to read your journey, insight and philosophy. It's a pleasure to read and know of your takes on market and life.

MNC🏹 @Focus_SME
Check & follow @devinamehra's timeline for lots of post debunking such rosy stories. Also, she gives amazing 🤩 sector directions/hints.

KLN Murthy @KLNMurthy2016
Good actionable insights, great article!

Suresh Nair @gkumarsuresh
Devina Madam is simply terrific... good knowledge, straight and simple thinking.
Very difficult to emulate such traits. I listen her past interviews from youtube.
Respect...!!!!

DD @AliensDelight
One of the brightest minds in the world of finance :)

Radhakrishnan Chonat @RCxNair
📣 Calling all investors! Just had an incredible interview with @devinamehra, Chairperson and MD of First Global. We discussed the importance of global diversification, effective asset allocation, and the risks of sitting on the sidelines. Trust me, you don't want to miss this!

siddarthmohta @siddarthmohta
Excellent performance. Flexibility is the key as you have mentioned it earlier also. Cannot have finite rules for infinite mkt opportunities.

Boom (বুম)@Booombaastic
To be honest, the insights which Devina madam brings in is very enriching..have learnt a lot from them...

Himanssh Kukreja @Himansh02428907
One of the most accurate analysts :)
I always look forward to you interviews mam

Abhijeet Deshpande @AbhijeetD2018
Madam, It is always a treat to read your insight, not only on business but on other topics also!!

Dada.AI @dada_on_twit
Thanks for this wisdom ma'am. Always love hearing your thoughts on everything equity. :-)

adil @zinndadil
Excellent points!
Can clearly feel this thread is a product of marination of many books and years of experience. 👍

Kamal thakur @Kamalgt10
Superb !!
Your knowledge, analysis & articulation is simply great 👍

Tanay @Tanay36232730
Follower on Twitter and Subsciber on YouTube of First Global, really helping me in my investment desicion. Thanks
Copyright 2019, All Rights Reserved. Developed By : Hvantage Technologies Inc. Maintain By : Aarav Infotech